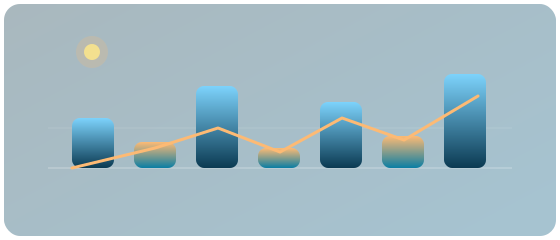
Orange = point forecast (centre), blue band = P10–P90 — same values as the full API tier.
Detailed explanation(expand)
The blue band shows the price range our AI expects for upcoming ML hours (from day after tomorrow) — not just a single number:
Point forecast (≈ P50)
The most likely hour-by-hour prediction — orange line in the chart, price_ct_kwh in the API. Matches the 50th percentile (P50): the midpoint of the expected range between P10 and P90.
P10 — conservative lower bound
In about 10% of similar situations the price was even lower. For grid charging, the Decision API often uses P10 — cautious enough for cheap windows without being overly pessimistic.
P90 — conservative upper bound
In about 90% of cases the price was lower; in 10% it could be higher. For discharge / export we use P90 — you do not plan too optimistically on high-price hours.
Why it matters: On sunny days the point forecast at midday may still be too high while P10 is already near zero — for batteries, EVs and heat pumps the band is a more robust planning basis than a single value.
P10–P90 band
Point forecast
What you see here
Three layers, one week.
Exchange first
Today shows cleared EPEX AT prices. Tomorrow is Day-Ahead after the auction (~13–16), and a model forecast before that.
Forecast after that
From the day after tomorrow, the hourly AI estimate through D+6, including typical deviation.
Plan, don’t stare
Best hours of the week turn the same prices into a charging window for EMS.
What the Forecast API returns
GET /v1/forecast — hourly prices out to 168 hours, plus source and quantiles.
price_ct_kwh
The hourly value in cents: exchange today, Day-Ahead tomorrow after the auction, forecast otherwise.
Source per hour
today and day_ahead only with a market price; gaps and D+2…D+6 as forecast.
price_p10 / p90
The band from the day after tomorrow — the same basis as Decision and Windows.
In short
Is this the same as Forecast in the portal?
No. This page is the public live week. Forecast in the portal is the chart demo with a table. The spec is under Docs.
Do I need an account?
Not for this live view. Community is for the API key, Hours and the full plant portal.